Venn diagrams examples with solution 2 3 circles A Venn diagram is a widely used diagram style that shows the logical relation between sets, popularized by John Venn in the 1880s. The diagrams are used to teach elementary set theory, and to illustrate simple set relationships mostly in topics like Quantitative methods, probability, logic, statistics, linguistics and computer science we have compiled you Venn diagram examples with solved solution to enable you understand and tackle Venn diagram questions or exams with ease.
Venn diagrams examples with solution 2 circles
Question 1
150 college freshman were interviewed
- 85 of them were registered in a math class
- 70 of them were registered for English class
- 50 of them were registered for both Math’s and English
- How many freshman sat signed up for only math’s classes?
- How many freshman sat signed up for only English classes?
- How many freshman sat signed up for only math’s or English classes?
- How many freshman sat signed up for neither math’s or English classes?
Solution 1
The best way to solve any Venn diagram question is to start by drawing two circles overlapping each other and to start solving from the last sentence of which here the last sentence is 50 of them were registered for both Math’s and English?. start with this question after drawing the overlapping two circles as you go to the second last until you finish with the first question which is; 85 of them were registered in a math class?
- 50 were registered for both math and English
- 70 were registered for for English class = 70-50=20
- 85 were registered in math =85-50=35
- 50+35+20=105
- 150-105=45
- How many freshman sat signed up for only math’s classes?=35
- How many freshman sat signed up for only English classes?=20
- How many freshman sat signed up for only math’s or English classes?=50
- How many freshman sat signed up for neither math’s or English classes? =45

Question 2, 3 circles Venn diagram and solution
100 college students were interviewed
- 28 of the college students took PE
- 31 of the college students took BIOLOGY
- 42 of the college students took ENGLISH
- 9 of the college students took PE and BIOLOGY
- 10 of the college students took PE and English
- 6 of the college students took BIOLOGY and ENGLISH
- 4 of the college students took all the three subjects
- How many of the college students took none of the three subjects?
- How many of the college students took PE but not BIO or ENGLISH?
- How many of the college students took BIOLOGY and PE but not ENGLISH?
Solution
The best way to solve any Venn diagram question is to start by drawing three circles overlapping each other and to start solving from the last sentence of which here the last sentence is 4 of the college students took all the three subjects. start with this by putting 4 in the area where all the circles overlap as you go to the second last 6 of the college students took BIOLOGY and ENGLISH 4 is already there so you will minus 6 by 4 you get 2. proceed filling the Venn diagram this way until you finish with the first question which is; 28 of the college students took PE? find the PE circle add up the filled numbers in the area and minus by the number of PE students given to find the answer.
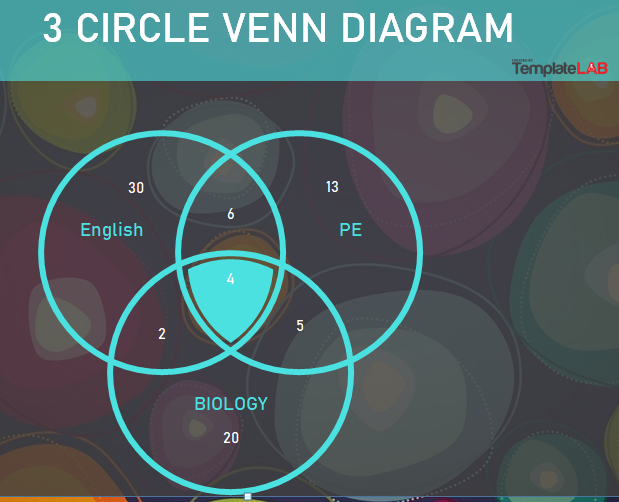
- How many of the college students took none of the three subjects?=30+20+13+6+4+5+2=80 (100-80=20)= 20 students
- How many of the college students took PE but not BIO or ENGLISH? 6+4+5=15 (28-15=13)= 13 students
- How many of the college students took BIOLOGY and PE but not ENGLISH? biology and PE overlap each other but avoid the English circle the answer is 5 students
Master Venn diagrams and probability questions for a chance to get over 20 marks on a single question
QUESTIONS AND ANSWERS TO STATISTICS, QUANTITATIVE TECHNIQUES, QUANTITATIVE METHODS E.T.C
- Frequency distribution table example with solution
- Examples & formulas for standard deviation variance mean for grouped data
- Time series analysis least square method solved examples
- Price index Laspeyres Paasche’s and fisher’s ideal price index questions and answers
- Probability questions and answers statistics
- Pearson’s Coefficient of correlation formula example & solution
- PERT network diagram critical path example and solution project management
- Examples & Formulas For Standard Deviation Variance Mean For Ungrouped Data
- Regression equation formula how to calculate solved example
QUANTITAVE METHODS NOTES(PDF)