Pearson’s Coefficient of correlation formula example & solution In statistics or quantitative methods, the Pearson correlation coefficient also known as Pearson’s r, the Pearson product-moment correlation coefficient, the bivariate correlation, or colloquially simply as the correlation coefficient is a measure of linear correlation between two sets of data. we have compiled you Pearson’s Coefficient of correlation formula, questions with solved solution to enable you understand and tackle Pearson’s Coefficient of correlation questions or exams with ease.
Definition of terms
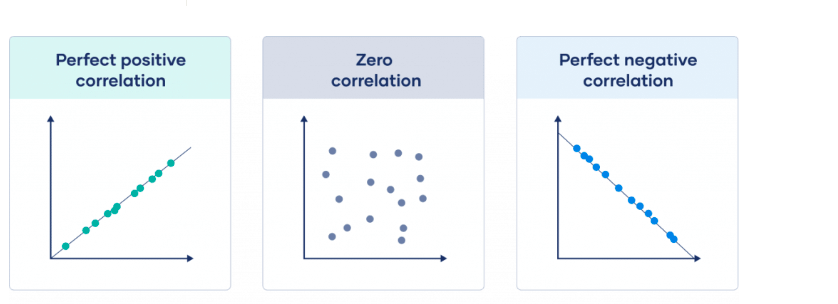
- How to interpret Pearson product-moment correlation: The sign (+ or -) of the correlation affects its interpretation. When the correlation is positive (r > 0), as the value of one variable increases, so does the other. 1 indicates a strong positive relationship. -1 indicates a strong negative relationship. A result of zero indicates no relationship at all.
Pearson’s Coefficient of correlation formula

 | = | correlation coefficient |
 | = | values of the x-variable in a sample |
 | = | mean of the values of the x-variable |
 | = | values of the y-variable in a sample |
 | = | mean of the values of the y-variable |
Interpreting the results of Pearson’s product moment co-efficient of correlation
| Correlation coefficient | Correlation strength | Correlation type |
| -.7 to -1 | Very strong | Negative |
| -.5 to -.7 | Strong | Negative |
| -.3 to -.5 | Moderate | Negative |
| 0 to -.3 | Weak | Negative |
| 0 | None | Zero |
| 0 to .3 | Weak | Positive |
| .3 to .5 | Moderate | Positive |
| .5 to .7 | Strong | Positive |
| .7 to 1 | Very strong | Positive |
Pearson’s Coefficient of correlation example and solutions
Example 1
The following information was extracted from the records of students showing relationship of their marks and attitude( correct X and attitude Y)
- Calculate the Pearson’s product moment co-efficient of correlation
- Interpret the result in 1 above
| correct X | attitude Y |
| 17 | 94 |
| 13 | 73 |
| 12 | 59 |
| 15 | 80 |
| 16 | 93 |
| 14 | 85 |
| 16 | 66 |
| 16 | 79 |
| 18 | 77 |
| 19 | 91 |
Solution 1
You will find the solution to the question above by drawing the exactly same table and adding other 5 columns for filling in values of (x(i)-mean(x))*(y(i)-mean(y)) / ((x(i)-mean(x))2 * (y(i)-mean(y))2 after filling all the values as shown below use the formula and pick the values to find your answer;
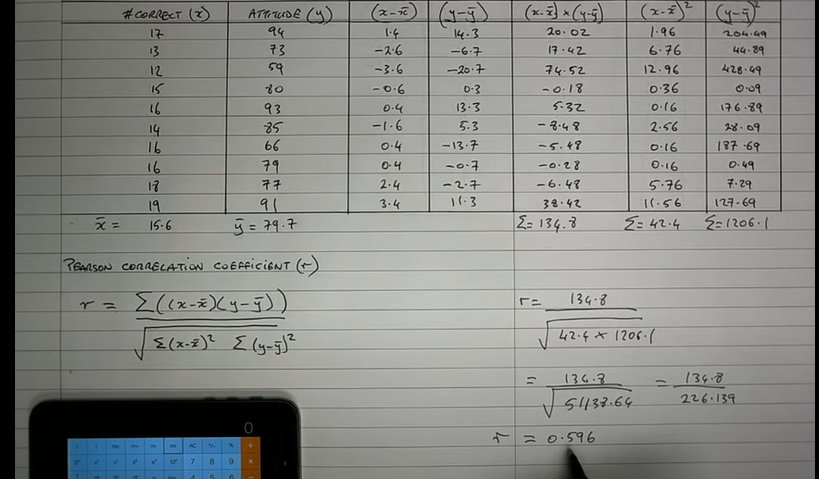
- Calculate the Pearson’s product moment co-efficient of correlation answer= r=0.596
- Interpret the result in 1 above= there is a positive weak correlation
QUESTIONS AND ANSWERS TO STATISTICS, QUANTITATIVE TECHNIQUES, QUANTITATIVE METHODS E.T.C
- Frequency distribution table example with solution
- Examples & formulas for standard deviation variance mean for grouped data
- Time series analysis least square method solved examples
- Price index Laspeyres Paasche’s and fisher’s ideal price index questions and answers
- Probability questions and answers statistics
- Examples & Formulas For Standard Deviation Variance Mean For Ungrouped Data
- PERT network diagram critical path example and solution project management
- Venn diagrams examples with solution 2 3 circles
- Regression equation formula how to calculate solved example
QUANTITAVE METHODS NOTES(PDF)