Examples & formulas for standard deviation variance mean for grouped data variance is the expectation of the squared deviation of a random variable from its population mean or sample mean. Variance is a measure of dispersion, meaning it is a measure of how far a set of numbers is spread out from their average value. The standard deviation is a measure of the amount of variation or dispersion of a set of values. A low standard deviation indicates that the values tend to be close to the mean of the set, while a high standard deviation indicates that the values are spread out over a wider range. Mean refers to the average of a set of values.
we have compiled you Examples & formulas for standard deviation variance mean for grouped data to enable you understand and tackle standard deviation variance mean for grouped data questions or exams with ease.
formulas for standard deviation variance mean for grouped data
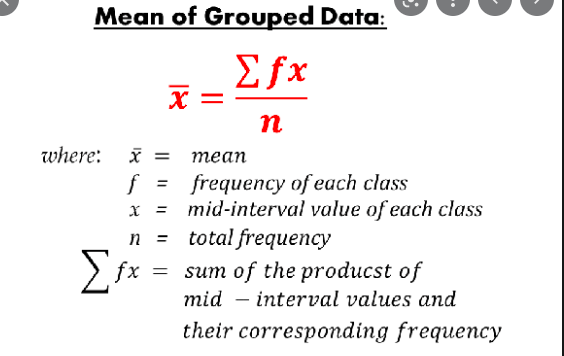
Mean for grouped data formula
To calculate the mean of grouped data given, the first step is to determine the midpoint of each interval or class. These midpoints must then be multiplied by the frequencies of the corresponding classes. The sum of the products divided by the total number of values will be the value of the mean the formula is;
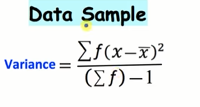
Variance formula for grouped data
variance is the expectation of the squared deviation of a random variable from its population mean or sample mean. Variance is a measure of dispersion, meaning it is a measure of how far a set of numbers is spread out from their average value the formula is given below
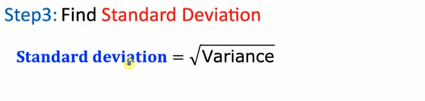
standard deviation formula for grouped data
standard deviation is a measure of the amount of variation or dispersion of a set of values. Standard deviation formula is simply the squareroot of the variance the answer you get from variance just squareroot it and you find the standard deviation
standard deviation variance mean for grouped data example and solved solution
The table below shows the frequency distribution for grouped data determine the following measures about the frequency distribution
| Scores | Frequency |
| 40-45 | 3 |
| 34-39 | 1 |
| 28-33 | 4 |
| 22-27 | 5 |
| 16-21 | 2 |
| 10-15 | 5 |
- Mean
- Variance
- Standard deviation
Solution
The first step is to draw the exam same table but you will add the 6 columns to fill in values for mid point (x) ,fx, (x-mean(x)), ((x-mean(x))2, mean(x) and f((x-mean(x))2. You can find the midpoint of a line segment given 2 endpoints, (x1, y1) Add each x-coordinate and divide by 2 to find x of the midpoint. To find the mean, variance and standard deviation use the formulas for example for mean after filling out the table do the summation of frequency multiplied by summation of x divided by summation of frequency. solved table shown below;
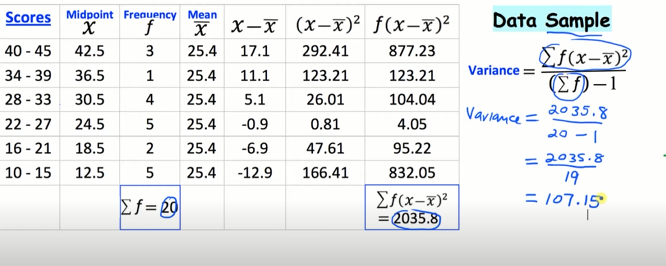
- Mean=508/20 answer 25.4
- Variance= 2035.8/20-1= 107.15
- Standard deviation=√ variance √ 107.15= 10.35
Pearson’s coefficient of correlation formula
QUANTITATIVE METHODS UNIT TOPICS COVERED
- Data and data collection
- Sampling procedures
- Tabulating and graphing frequency distribution
- Measures of location
- Measures of dispersion
- Index numbers
- Correlation
- Linear regression
- Time series analysis
- Probability
- Binomial and poisson distributions
QUANTITAVE METHODS NOTES(PDF)