Probability questions and answers statistics Probability is the branch of mathematics and statistics concerning numerical descriptions of how likely an event is to occur, or how likely it is that a proposition is true. we have compiled you Probability questions examples with solved solution to enable you understand and tackle Probability questions or exams with ease.
Probability definition of terms
- systematic sampling: a probability sampling method where researchers select members of the population at a regular interval
- Quota sampling: Quota sampling is a method for selecting survey participants that is a non-probabilistic version of stratified sampling
- Stratified sampling: Stratified random sampling is a method of sampling that involves dividing a population into smaller groups called strata. The groups or strata are organized based on the same characteristics
- Mutually exclusive events: Mutually exclusive events are those events that do not occur at the same time. For example, when a coin is tossed then the result will be either head or tail this means they do not share the same outcomes
- simple random sample: a simple random sample is a subset of individuals chosen from a larger set in which a subset of individuals are chosen randomly, all with the same probability.
- multi-stage sampling: multistage sampling is the taking of samples in stages using smaller and smaller sampling units at each stage.
- Cluster sampling: dividing a population into smaller groups known as clusters then randomly selecting among these clusters to form a sample.
Probability questions and answers
Question 1
A bag contains 6 red counters and 4 blue counters. two counters are picked from the bag at random without replacement
- Represent the events using a tree diagram
- Find the probability that the two counters picked are same color
Solution 1
A tree diagram in this probability may be used to represent a probability space. Tree diagrams may represent a series of independent events or conditional probabilities. Each node on the diagram represents an event and is associated with the probability of that event. in the question above we have 6red and 4 blue counters giving us a total of 10 counters but they are picked without replacement so we shall have the solution below;
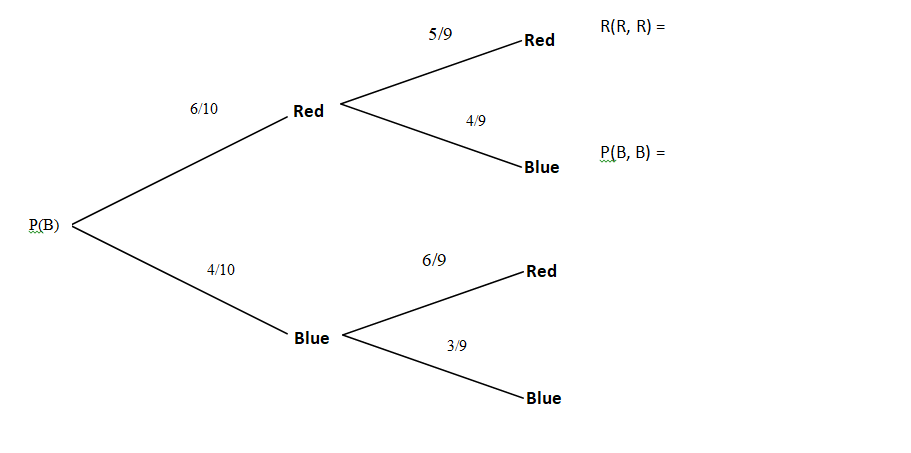
Find the probability that the two counters picked are same color;
Use the tree diagram to see the same colors of which here the same colors are Red and Red also Blue and Blue =
| P(R, R) &P (B, B) 6/10×5/9 + 4/10 × 3/9= 7/15 is the answer |
Question 2
A committee of 3 people was chosen at random from a group of 5 men and 6 women. Find the probability that the committee consisted of more men than women
Solution 2
A tree diagram in this probability is drawn so that it may be used to represent a probability space. Tree diagrams may represent a series of independent events or conditional probabilities. Each node on the diagram represents an event and is associated with the probability of that event. in the question above we have A committee of 3 people was chosen at random from a group of 5 men and 6 women. 5men and 6 women giving us a total of 11 so we shall have the solution in the tree diagram below;
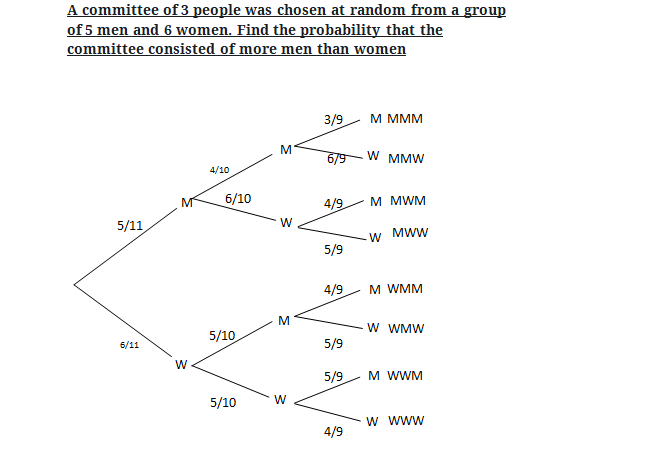
Committee consisted of more men than women
Answer= (MMW) (MWM) (WMM) (5/11 × 4/10 × 6/9) +(5/11 × 6/10 × 4/9) +(6/11 × 5/10 × 4/9)= 12/33 SIMPLIFIED TO 4/11
Master Venn diagrams and probability questions for a chance to get over 20 marks on a single question
QUESTIONS AND ANSWERS TO STATISTICS, QUANTITATIVE TECHNIQUES, QUANTITATIVE METHODS E.T.C
- Frequency distribution table example with solution
- Examples & formulas for standard deviation variance mean for grouped data
- Time series analysis least square method solved examples
- Price index Laspeyres Paasche’s and fisher’s ideal price index questions and answers
- Pearson’s Coefficient of correlation formula example & solution
- PERT network diagram critical path example and solution project management
- Venn diagrams examples with solution 2 3 circles
- Regression equation formula how to calculate solved example
- Examples & Formulas For Standard Deviation Variance Mean For Ungrouped Data
QUANTITAVE METHODS NOTES(PDF)
This is wonderful job Keep up
appreciate you