Price index Laspeyres Paasche’s and fisher’s ideal price index questions and answers price index is a normalized average of price relatives for a given class of goods or services in a given region, during a given interval of time. It is a statistic designed to help to compare how these price relatives, taken as a whole, differ between time periods or geographical locations.
Definition of terms
- Laspeyres price index; The Laspeyres price index is an index formula used in price statistics and quantitative methods for measuring the price development of the basket of goods and services consumed in the base period. The question it answers is how much a basket that consumers bought in the base period would cost in the current period
- Paasche’s price index; The Paasche index is a composite index number of price arrived at by the weighted sum method. This index number corresponds to the ratio of the sum of the prices of the actual period n and the sum of prices of the reference period 0, these sums being weighted by the respective quantities of the actual period.
- fisher’s ideal price index Fisher’s Ideal price index is the geometric mean of the Laspeyres and Paasche volume indices. A measure of change in volume from period to period. It is calculated as the squareroot answer of Laspeyres multiplied by paasche’s then multiplied by 100
Price index Laspeyres Paasche’s and fisher’s ideal price index questions and answers
Question 1
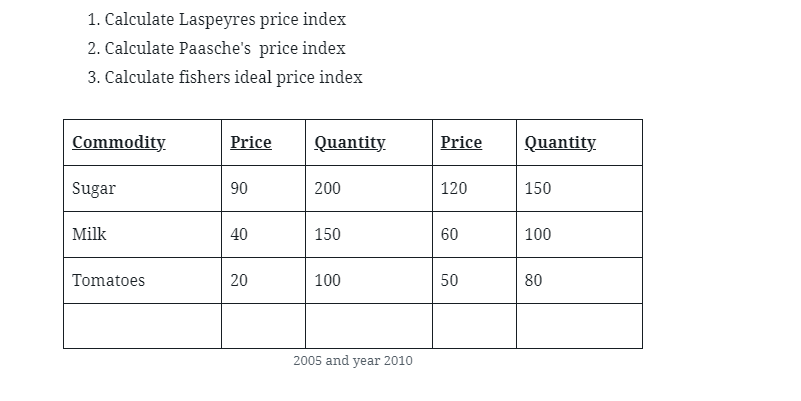
The prices and quantities of 3 commodities in a country for the year 2005 and 2010 are given in the table below
- Calculate Laspeyres price index
- Calculate Paasche’s price index
- Calculate fishers ideal price index
| Commodity | Price | Quantity | Price | Quantity |
| Sugar | 90 | 200 | 120 | 150 |
| Milk | 40 | 150 | 60 | 100 |
| Tomatoes | 20 | 100 | 50 | 80 |
Laspeyres price index
You will start your calculation by drawing the exact same table and adding the columns for PiQo and PoQo. The Laspeyres price index is an index formula used in price statistics and quantitative methods for measuring the price development of the basket of goods and services consumed in the base period the formula of Laspeyres price index is;

Where:
- Pi The price of good i in the current year
- Po: The price of good i in the base year
- Qi: The quantity consumed of good i in the current year
- Qo: The quantity consumed of good i in the base year
| Po | Qo | Pi | Qi | |||||||||
| Commodity | Price | Quantity | Price | Quantity | PiQo | PoQo | PiQi | PoQi | ||||
| Sugar | 90 | 200 | 120 | 150 | 24000 | 18000 | 18000 | 13500 | ||||
| Milk | 40 | 150 | 60 | 100 | 9000 | 6000 | 6000 | 4000 | ||||
| Tomatoes | 20 | 100 | 50 | 80 | 5000 | 2000 | 4000 | 1600 | ||||
To find your respective answer do the summation then use the formula shown. 38000/26000×100= 146.154
Paasche’s price index
You will start your calculation by drawing the exact same table and adding the columns for PiQi and PoQi. The formula of Paasches price index is;

To find your respective answer do the summation then use the formula shown.8100/9100×100= 89.01
fisher’s ideal price index
You will start using the answers found for Laspeyres, paasches to find fisher’s ideal. The formula of Fisher’s ideal price index is;
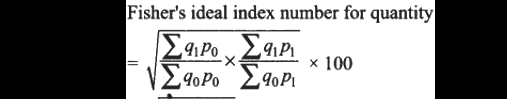
To find your respective answer do the summation then use the formula shown. answer is (√ Laspeyres×Paasches) × 100= (√146.154×89.01) × 100= 1140.577
Solution 1
The prices and quantities of 3 commodities in a country for the year 2005 and 2010 are given in the table below
| Commodity | Price | Quantity | Price | Quantity |
| Sugar | 90 | 200 | 120 | 150 |
| Milk | 40 | 150 | 60 | 100 |
| Tomatoes | 20 | 100 | 50 | 80 |
| Po | Qo | Pi | Qi | |||||||||
| Commodity | Price | Quantity | Price | Quantity | PiQo | PoQo | PiQi | PoQi | ||||
| Sugar | 90 | 200 | 120 | 150 | 24000 | 18000 | 18000 | 13500 | ||||
| Milk | 40 | 150 | 60 | 100 | 9000 | 6000 | 6000 | 4000 | ||||
| Tomatoes | 20 | 100 | 50 | 80 | 5000 | 2000 | 4000 | 1600 | ||||
- Calculate Laspeyres price index= 38000/26000×100= 146.154
- Calculate Paasche’s price index= 8100/9100×100= 89.01
- Calculate fishers ideal price index= (√146.154×89.01) × 100= 1140.577
Factors to be considered when calculating index numbers
- purpose of index number
- Selection of commodities
- Selection of an average
- Selection of weights
QUESTIONS AND ANSWERS TO STATISTICS, QUANTITATIVE TECHNIQUES, QUANTITATIVE METHODS E.T.C
- Frequency distribution table example with solution
- Examples & formulas for standard deviation variance mean for grouped data
- Examples & Formulas For Standard Deviation Variance Mean For Ungrouped Data
- Time series analysis least square method solved examples
- Probability questions and answers statistics
- Pearson’s Coefficient of correlation formula example & solution
- PERT network diagram critical path example and solution project management
- Venn diagrams examples with solution 2 3 circles
- Regression equation formula how to calculate solved example
QUANTITAVE METHODS NOTES(PDF)