PERT network diagram critical path example and solution project management. Program Evaluation Review Technique (PERT) in project management is a planning tool used to calculate the amount of time it will take to realistically finish a project. PERT charts are used to plan tasks within a project making it easier to schedule and coordinate team members it will also enable you identify the earlier start time and latest start time for each activity. Grab a pen and a paper to start learning;
PERT definition of terms
- PERT: Program Evaluation Review Technique
- Dangling activity in network diagram: It means an event which is not connected to another event by an activity. An activity is merging into the event, but no activity is starting or emerging from that event
- Event: The beginning and end points of an activity
- Loop: This is the specific and particular schedule network path
- Activity: An individual operation which utilizes resources and has beginning and end
- Project: combination of activities which must be executed in a certain order for its completion
- Network: Graphical representation of logical and sequentially connected activities and events.
- Optimistic Time: The shortest time required to complete the task.
- Pessimistic Time: The longest time required to complete the task.
- Most Likely Time: The most possible time (probable duration) required to complete the task.
PERT network diagram critical path example and solution project management
Example 1
The table below shows 8 activities A to H and their duration in days for a certain project use it to answer the questions that follows;
- Construct a PERT network
- Determine the project duration
- Determine the critical path
| ACTIVITY | PREDECESSOR | DURATION(Days) |
| A | – | 3 |
| B | A | 4 |
| C | A | 2 |
| D | B | 5 |
| E | C | 1 |
| F | C | 2 |
| G | D,E | 4 |
| H | F,G | 3 |
Solution 1
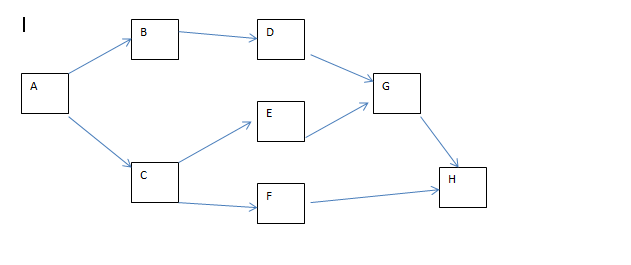
The FIRST STEP is to DRAW a predecessor and activity sketch where you use the table to plot example here we have activity B comes from predecessor A Activity C also comes from predecessor A activity G comes from D and E use arrows and plot as follows
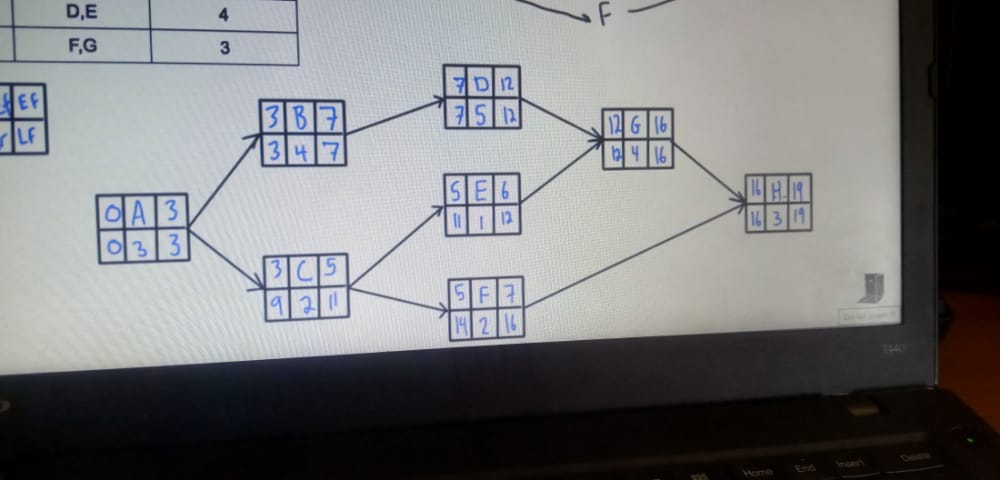
build a diagram building a network diagram and estimating the activity durations, you will determine the critical path by making forward and backward pass calculations. Early finish to early start the larger value going forward from early finish moves to the next early start. early start plus duration you get early finish,
After filling there you move backwards by bringing early finish value to late finish and instead of adding you will minus with duration as you fill the values on late start. instead of following the arrow with larger values here you will choose the smaller value to be carried to the late finish of competing arrows if no competing arrows the value of late start will be carried to late finish that way.
- Construct a PERT network
- Determine the project duration
- Determine the critical path= To identify critical path find early finish and late finish with same values here the answer is A→B→D→G→H
QUESTIONS AND ANSWERS TO STATISTICS, QUANTITATIVE TECHNIQUES, QUANTITATIVE METHODS E.T.C
- Frequency distribution table example with solution
- Examples & formulas for standard deviation variance mean for grouped data
- Time series analysis least square method solved examples
- Price index Laspeyres Paasche’s and fisher’s ideal price index questions and answers
- Probability questions and answers statistics
- Pearson’s Coefficient of correlation formula example & solution
- Examples & Formulas For Standard Deviation Variance Mean For Ungrouped Data
- Venn diagrams examples with solution 2 3 circles
- Regression equation formula how to calculate solved example
QUANTITAVE METHODS NOTES(PDF)


Have learnt alot thanks
welcome