Frequency distribution table example with solution A frequency distribution is a representation, either in a graphical or tabular format, that displays the number of observations within a given interval. The interval size depends on the data being analyzed and the goals of the analyzer.
we have compiled you Frequency distribution table example with solution to enable you understand and tackle Frequency distribution table questions or exams with ease.
Frequency distribution definition of terms
- Frequency distribution; is a representation, either in a graphical or tabular format, that displays the number of observations within a given interval. The interval size depends on the data being analyzed and the goals of the analyzer.
- Types of frequency distributions; The types of frequency distribution are ungrouped frequency distributions, grouped frequency distributions, cumulative frequency distributions, and relative frequency distributions.
- Ungrouped frequency distribution; The ungrouped frequency distribution is a distribution that displays the frequency of each individual data value instead of groups of data values.
- grouped frequency distributions; shows the scores by grouping the observations into intervals called class limits and then lists these intervals in the frequency distribution table.
- cumulative frequency distributions; cumulative frequency distribution is calculated by adding each frequency from a frequency distribution table to the sum of its predecessors. The last value will always be equal to the total for all observations, since all frequencies will already have been added to the previous total.
- relative frequency distributions; shows the proportion of the total number of observations associated with each value or class of values and is related to a probability distribution, which is extensively used in statistics and mathematics.
- Class frequency; The frequency of a class interval is the number of observations that occur in a particular predefined interval. So, for example, if 10 people aged 1 to 20 appear in our study’s data, the frequency for the 1–20 interval is 10. The endpoints of a class interval are the lowest and highest values that a variable can take
Frequency distribution table example with solution
Example 1
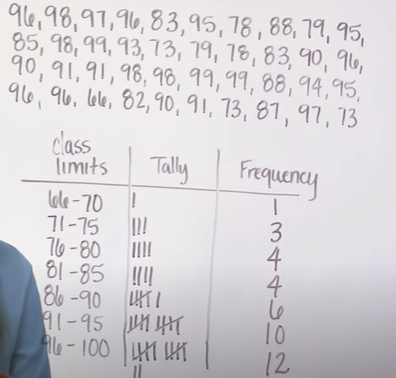
A supervisor in a factory recorded the following figures of lateness in minutes for 40 workers
| 96 | 98 | 97 | 96 | 83 | 95 | 78 | 88 | 79 | 95 |
| 85 | 98 | 99 | 93 | 73 | 79 | 78 | 83 | 90 | 96 |
| 90 | 91 | 91 | 98 | 98 | 99 | 99 | 88 | 94 | 95 |
| 96 | 96 | 66 | 82 | 90 | 91 | 73 | 87 | 97 | 73 |
- Construct a frequency distribution for the data shown
Solution 1
The first step in solving this frequency distribution table is to organize the data to frequency distribution find the range of the data by subtracting the highest value to the lowest value 99-66=33. Then find class width which is always values from 5,10 to 15 class width=Range/classes you want 33/7= 5 the table below is your solved frequency distribution table;
QUESTIONS AND ANSWERS TO STATISTICS, QUANTITATIVE TECHNIQUES, QUANTITATIVE METHODS E.T.C
- Examples & Formulas For Standard Deviation Variance Mean For Ungrouped Data
- Examples & formulas for standard deviation variance mean for grouped data
- Time series analysis least square method solved examples
- Price index Laspeyres Paasche’s and fisher’s ideal price index questions and answers
- Probability questions and answers statistics
- Pearson’s Coefficient of correlation formula example & solution
- PERT network diagram critical path example and solution project management
- Venn diagrams examples with solution 2 3 circles
- Regression equation formula how to calculate solved example
QUANTITAVE METHODS NOTES(PDF)