Examples & formulas for standard deviation variance mean for ungrouped data variance is the expectation of the squared deviation of a random variable from its population mean or sample mean. Variance is a measure of dispersion, meaning it is a measure of how far a set of numbers is spread out from their average value. The standard deviation is a measure of the amount of variation or dispersion of a set of values. A low standard deviation indicates that the values tend to be close to the mean of the set, while a high standard deviation indicates that the values are spread out over a wider range. Mean refers to the average of a set of values.
we have compiled you Examples & formulas for standard deviation variance mean for ungrouped data to enable you understand and tackle standard deviation variance mean for ungrouped data questions or exams with ease.
formulas for standard deviation variance mean for ungrouped data
Mean for ungrouped data formula
To calculate the mean of ungrouped data given, the formula is;
Variance formula for ungrouped data
variance is the expectation of the squared deviation of a random variable from its population mean or sample mean. Variance is a measure of dispersion, meaning it is a measure of how far a set of numbers is spread out from their average value the formula is given below
∑ (x − x̅)2 / n
standard deviation formula for ungrouped data
standard deviation is a measure of the amount of variation or dispersion of a set of values. Standard deviation formula is simply the squareroot of the variance the answer you get from variance just squareroot it and you find the standard deviatio =√ variance
standard deviation variance mean for ungrouped data example and solved solution
The values below shows the frequency distribution for ungrouped data determine the following measures about the frequency distribution: 6,7,8,9,10
- Mean
- Variance
- Standard deviation
Solution
The first step is to draw the table but you will add the columns to fill in values for (x) ,(x-mean(x)), ((x-mean(x))2, mean(x) as shown below
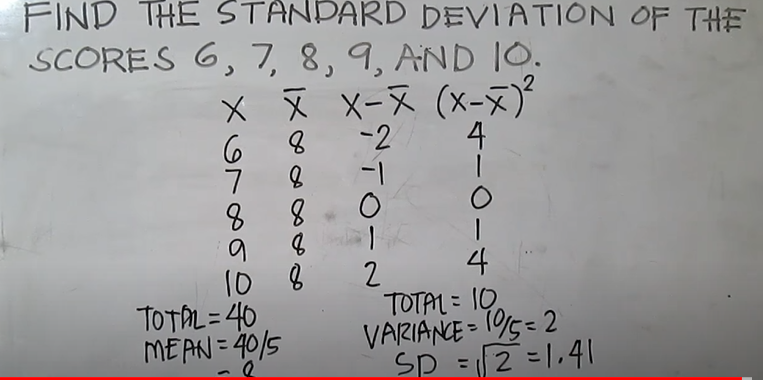
- Mean=40/5 answer 8
- Variance= 10/5= 2
- Standard deviation=√ variance √ 2= 1.41
Pearson’s coefficient of correlation formula
QUESTIONS AND ANSWERS TO STATISTICS, QUANTITATIVE TECHNIQUES, QUANTITATIVE METHODS E.T.C
- Frequency distribution table example with solution
- Examples & formulas for standard deviation variance mean for grouped data
- Time series analysis least square method solved examples
- Price index Laspeyres Paasche’s and fisher’s ideal price index questions and answers
- Probability questions and answers statistics
- Pearson’s Coefficient of correlation formula example & solution
- PERT network diagram critical path example and solution project management
- Venn diagrams examples with solution 2 3 circles
- Regression equation formula how to calculate solved example
QUANTITAVE METHODS NOTES(PDF)