Regression equation formula how to calculate solved example Regression is a statistical method used in finance, investing, and other mathematical disciplines that attempts to determine the strength and character of the relationship between one dependent variable (usually denoted by Y) and a series of other variables (known as independent variables). we have compiled you Regression equation formula how to calculate solved example to enable you understand and tackle Regression equation questions or exams with ease.
Regression definition of terms
- Regression; a statistical method used in finance, investing, and other mathematical disciplines that attempts to determine the strength and character of the relationship between one dependent variable (usually denoted by Y) and a series of other variables (known as independent variables)
- Regression vs correlation; The difference between two statistical measurements regression and correlation is that correlation measures the degree of a relationship between two variables (x and y), whereas regression is how one variable affects another.
- Types of regression include; simple linear regression and multiple linear regression.
- Regression analysis; is a set of statistical processes for estimating the relationships between a dependent variable and one or more independent variables.
- Regression line; is an estimate of the line that describes the true, but unknown, linear relationship between the two variables
- Multiple regression; is a statistical technique that can be used to analyze the relationship between a single dependent variable and several independent variables.
Regression equation formula how to calculate solved example
Regression equation formula


Regression equation example 1
From the given data, calculate regression equations taking deviation of items from the mean of x and y series;
| X | 1 | 2 | 3 | 4 | 5 |
| Y | 2 | 5 | 11 | 8 | 14 |
Solution 1
The first step is to draw the table that will fill values available on your formula as shown below;
| X | Values Y | X (x- x̅) | X2 | xy | Y=(y − ȳ) | y2 |
| 1 | 2 | -2 | 4 | 12 | -6 | 36 |
| 2 | 5 | -1 | 1 | 3 | -3 | 9 |
| 3 | 11 | 0 | 0 | 0 | 3 | 9 |
| 4 | 8 | 1 | 1 | 0 | 0 | 0 |
| 5 | 14 | 2 | 4 | 12 | 6 | 36 |
| ΣY =40 | Σx =0 | Σ X2 =10 | ΣXY =27 |
x̅=Σx/n 15/5= 3 ȳ= Σy/n 40/5= 8
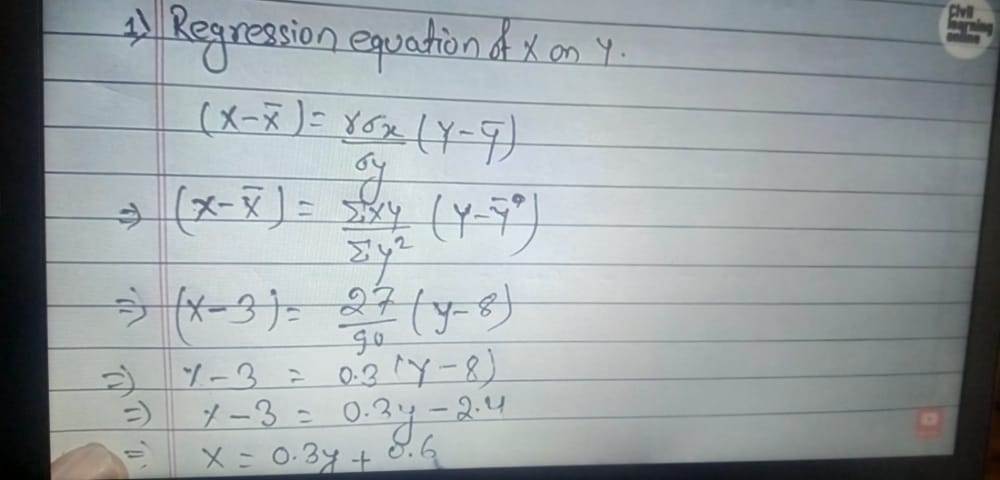
Regression equation of x on y use the formula as shown below; answer= x=0.3y+0.6

Regression equation of y on x answer= Y=2.7x+0.1

correlation of coefficient answer= √ 2.7×0.3=0.9

Pearson’s coefficient of correlation formula
QUESTIONS AND ANSWERS TO STATISTICS, QUANTITATIVE TECHNIQUES, QUANTITATIVE METHODS E.T.C
- Frequency distribution table example with solution
- Examples & Formulas For Standard Deviation Variance Mean For Ungrouped Data
- Examples & formulas for standard deviation variance mean for grouped data
- Time series analysis least square method solved examples
- Price index Laspeyres Paasche’s and fisher’s ideal price index questions and answers
- Probability questions and answers statistics
- Pearson’s Coefficient of correlation formula example & solution
- PERT network diagram critical path example and solution project management
- Venn diagrams examples with solution 2 3 circles
QUANTITAVE METHODS NOTES(PDF)


I love you guys…I like the analysis that uve done and uve really helped us get what we need easily