Time series analysis least square method solved examples In statistics or mathematics, a time series is a series of data points indexed (or listed or graphed) in time order. Most commonly, a time series is a sequence taken at successive equally spaced points in time. Thus it is a sequence of discrete-time data. The method of least squares is a standard approach in regression analysis to approximate the solution of overdetermined systems by minimizing the sum of the squares of the residuals made in the results of each individual equation. The most important application is in data fitting.
we have compiled you Time series analysis least square method solved examples to enable you understand and tackle Time series analysis least square method questions or exams with ease.
Time series definition of terms
- Time series; A collection of observation of well defined data items obtained through repeated measurement over time. the components of time series are: secular trend, seasonal variations, cyclical fluctuations and irregular variations.
- seasonal variations: is variation in a time series within one year that is repeated more or less regularly. Seasonal variation may be caused by the temperature, rainfall, public holidays, cycles of seasons or holidays.
- cyclical fluctuations; refers to regular periodic fluctuations around the trend, excluding the irregular component, revealing a succession of phases of expansion and contraction.
- secular trend; describes the movement over the long term of a time series that globally can be increasing, decreasing, or stable. The secular trend can be linear or not.
- irregular variations; Irregular variations or random variations are not predictable constitute one of four components of a time series. They correspond to the movements that appear irregularly and generally during short periods.
Importance of time series analysis
- Helps in cleaning the data
- Understanding the data
- For predicting the future
Time series analysis least square method solved examples
Example 1
The table below shows the profit made by textile company within 2011 and 2019
- Use the least square method to estimate the trend line equation and values
- Estimate the profit for the year 2021
| Year | Values |
| 2011 | 9.8 |
| 2012 | 11.5 |
| 2013 | 13.2 |
| 2014 | 12.8 |
| 2015 | 12.6 |
| 2016 | 12.1 |
| 2017 | 13.8 |
| 2018 | 15.3 |
| 2019 | 17.5 |
Solution 1
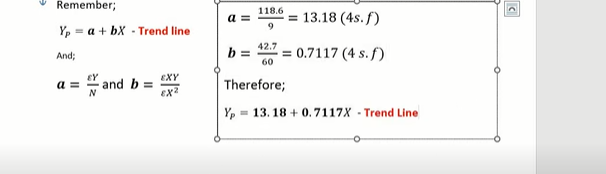
The first step to identify and solve the least squares is to know the formula which is given by yP=a+bx where a=sumation of y/N and b =summation of product of xy/(x)squared. You will draw the exaxt same table and add 4 columns for values of X, X2, XY and the trend values which is Yp=a+bx X is found by finding the values of N and pick the mid point
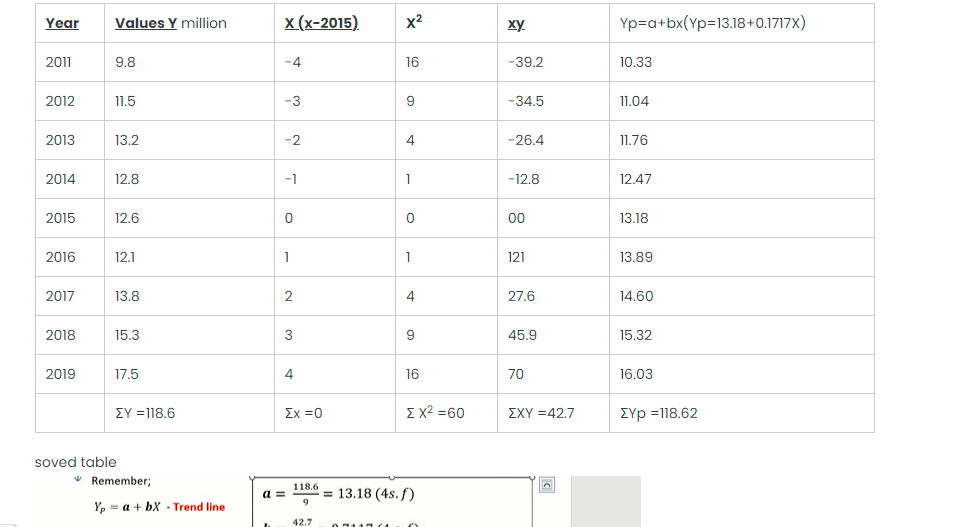
| Year | Values Y million | X (x-2015) | X2 | xy | Yp=a+bx(Yp=13.18+0.1717X) |
| 2011 | 9.8 | -4 | 16 | -39.2 | 10.33 |
| 2012 | 11.5 | -3 | 9 | -34.5 | 11.04 |
| 2013 | 13.2 | -2 | 4 | -26.4 | 11.76 |
| 2014 | 12.8 | -1 | 1 | -12.8 | 12.47 |
| 2015 | 12.6 | 0 | 0 | 00 | 13.18 |
| 2016 | 12.1 | 1 | 1 | 121 | 13.89 |
| 2017 | 13.8 | 2 | 4 | 27.6 | 14.60 |
| 2018 | 15.3 | 3 | 9 | 45.9 | 15.32 |
| 2019 | 17.5 | 4 | 16 | 70 | 16.03 |
| ΣY =118.6 | Σx =0 | Σ X2 =60 | ΣXY =42.7 | ΣYp =118.62 |
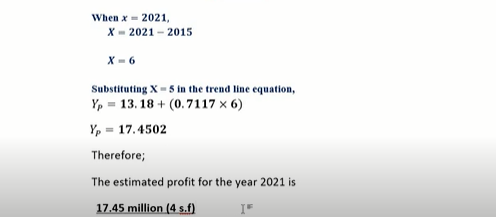
Estimate the profit for the year 2021
- Use the least square method to estimate the trend line equation and values= answer is Yp=13.18+0.1717X
- Estimate the profit for the year 2021 answer is 17.45million
QUESTIONS AND ANSWERS TO STATISTICS, QUANTITATIVE TECHNIQUES, QUANTITATIVE METHODS E.T.C
- Examples & Formulas For Standard Deviation Variance Mean For Ungrouped Data
- Examples & formulas for standard deviation variance mean for grouped data
- Price index Laspeyres Paasche’s and fisher’s ideal price index questions and answers
- Probability questions and answers statistics
- Pearson’s Coefficient of correlation formula example & solution
- PERT network diagram critical path example and solution project management
- Venn diagrams examples with solution 2 3 circles
- Regression equation formula how to calculate solved example
- Frequency distribution table example with solution
QUANTITAVE METHODS NOTES(PDF)